Security Dashboard
The Security Dashboard within the Insights Module offers a comprehensive overview of your cloud infrastructure's security posture. It utilizes complex data analytics to present clear, actionable insights, enabling teams to fortify their cloud operations against potential threats.
Security Dashboard Features
This feature is an integral part of the Insights module, designed to offer a panoramic view of your cloud security. It focuses on identifying security gaps by showcasing failed checks, thereby facilitating a targeted approach towards strengthening security defenses.
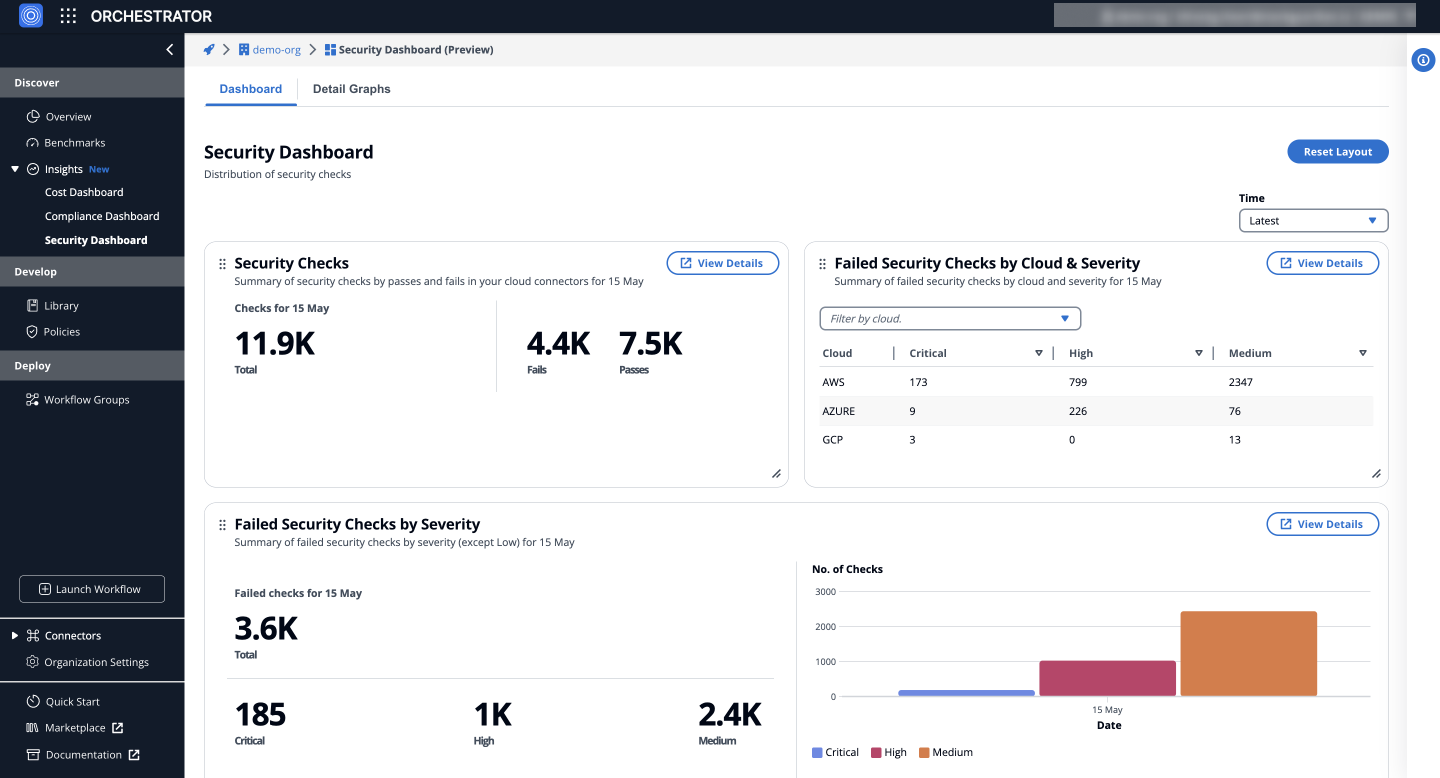
a) Security Checks
Offers a summary of security checks, including both passes and fails across your cloud connectors, providing a comprehensive count of checks conducted and their outcomes.
b) Failed Security Checks by Cloud & Severity
Illustrates the distribution of failed security checks across various clouds (AWS, Azure, GCP, etc.) and their severity levels (high, medium, low), enabling pinpointed security enhancements.
c) Failed Security Checks by Severity
Displays the total number of failed security checks categorized by severity, highlighting the areas that necessitate urgent attention.
Insights: Security dashboard
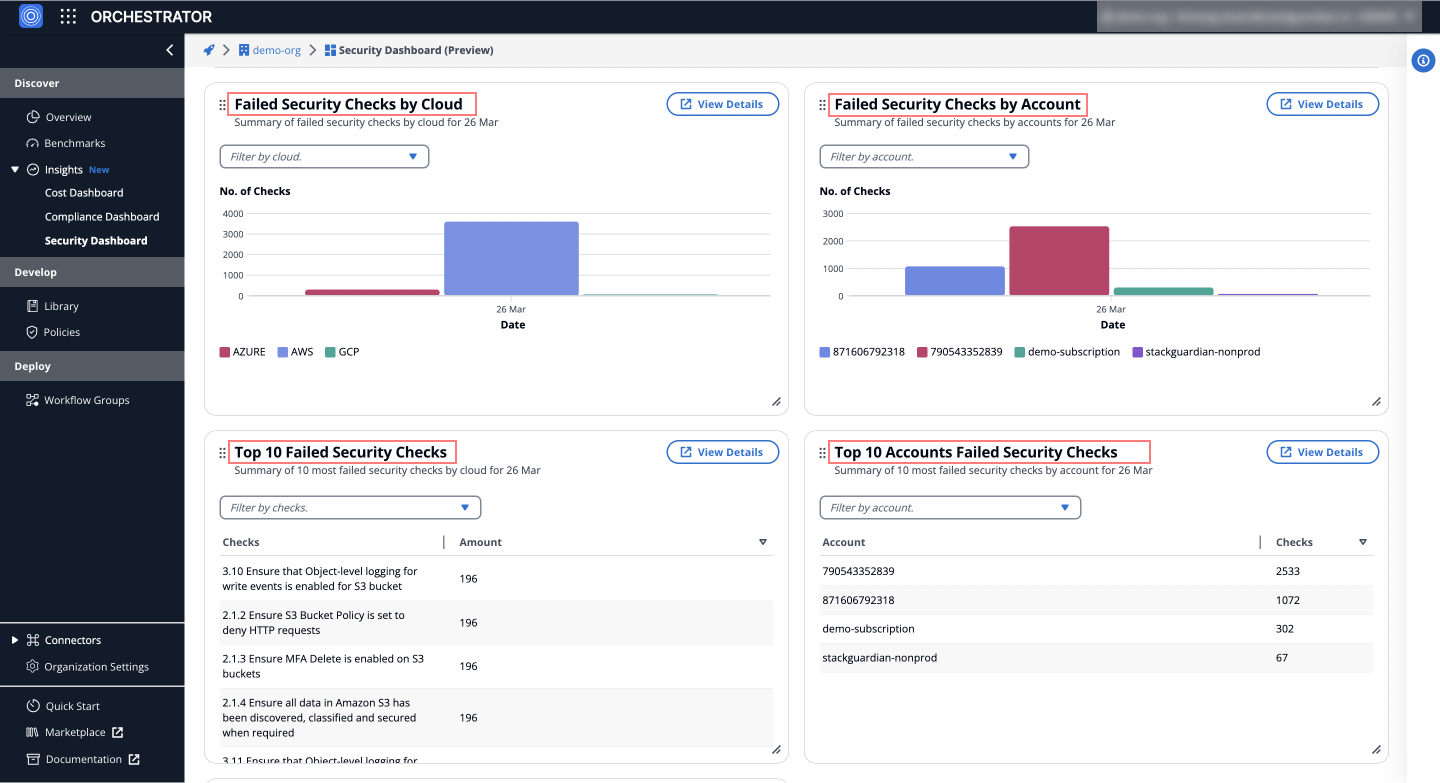
d) Failed Security Checks by Cloud
Summarizes failed security checks per cloud provider, offering insights into which cloud environments may be more vulnerable or exposed to threats due to misconfigurations or lapses in security practices.
e) Failed Security Checks by Account
Details failed security checks by account, aiding in identifying specific accounts that might be disproportionately vulnerable or at risk.
f) Top 10 Failed Security Checks
Lists the 10 most failed security checks, pinpointing common vulnerabilities or lapses in security measures across the cloud infrastructure.
g) Top 10 Accounts Failed Security Checks
Highlights the top 10 accounts with the most failed security checks, suggesting potential focal points for security improvement and risk mitigation.
Insights: Security dashboard
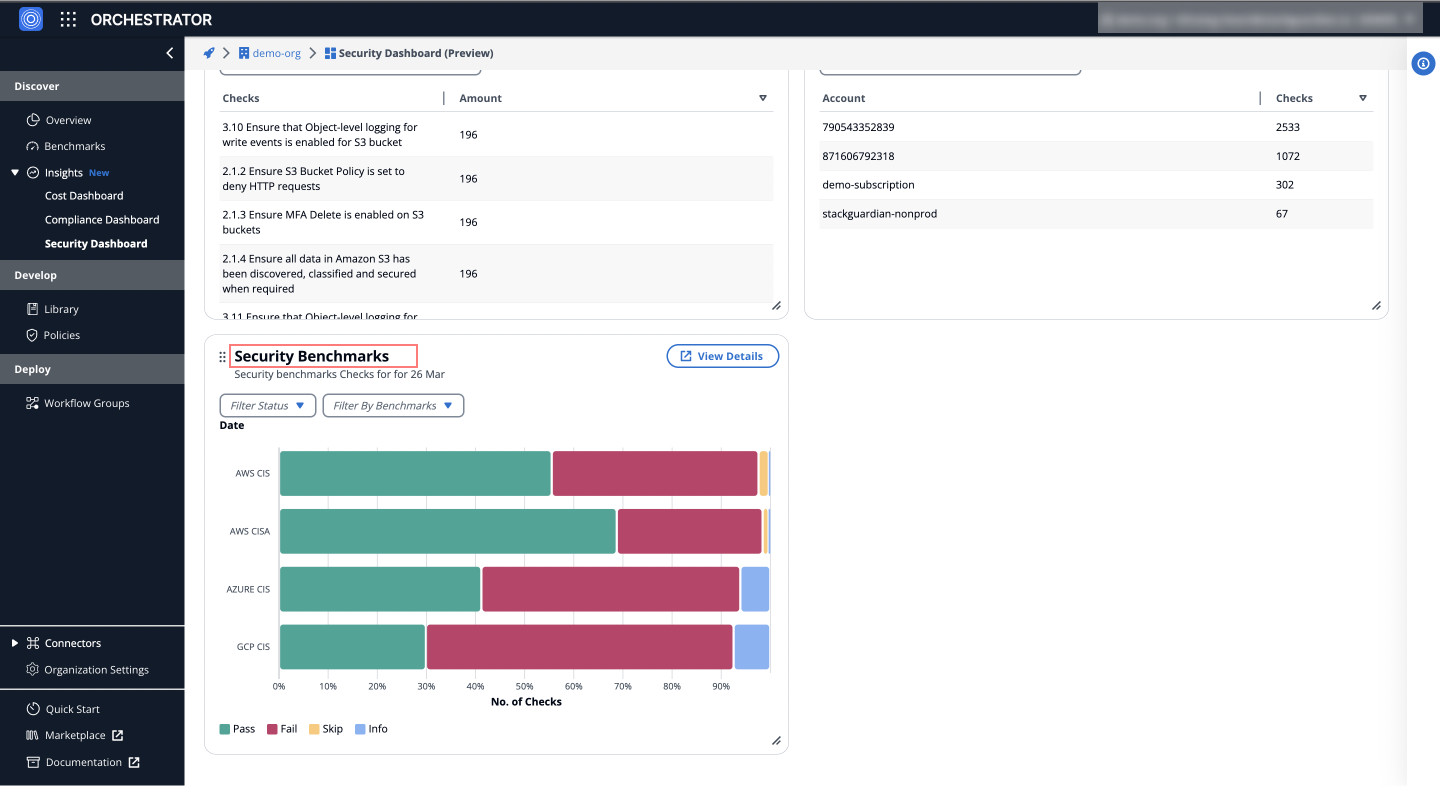
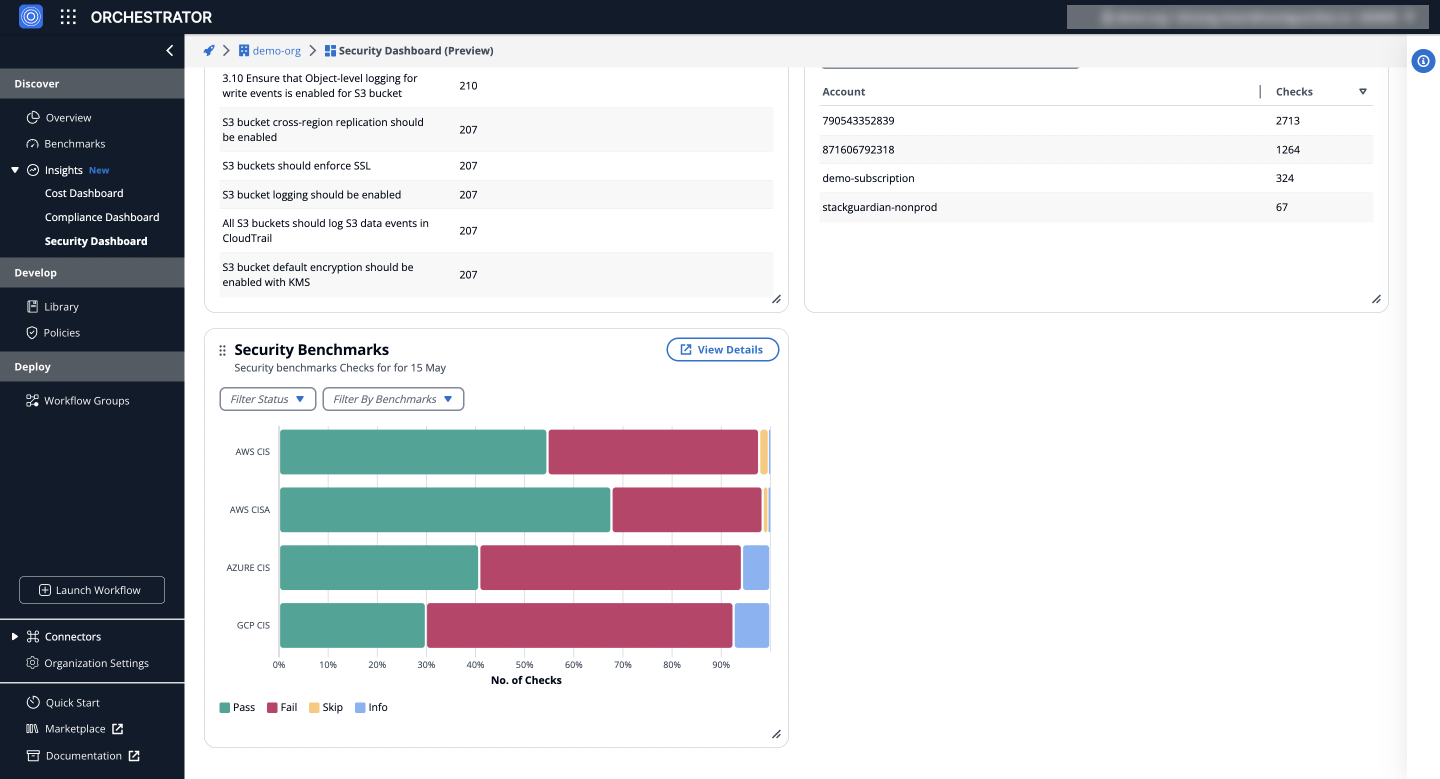
h) Security Benchmarks
Presents security benchmark checks for your cloud infrastructure, categorized by compliance standards (AWS CIS, Azure CIS, etc.), facilitating a standards-based assessment of your cloud security posture.
Insights: Security dashboard
g) Security benchmark
Categorizes checks for AWS CIS, AWS CISA, AZURE CIS, and GCP CIS into pass, fail, skip, and info, aiding in the swift identification and resolution of security issues.
Insights: Security dashboard
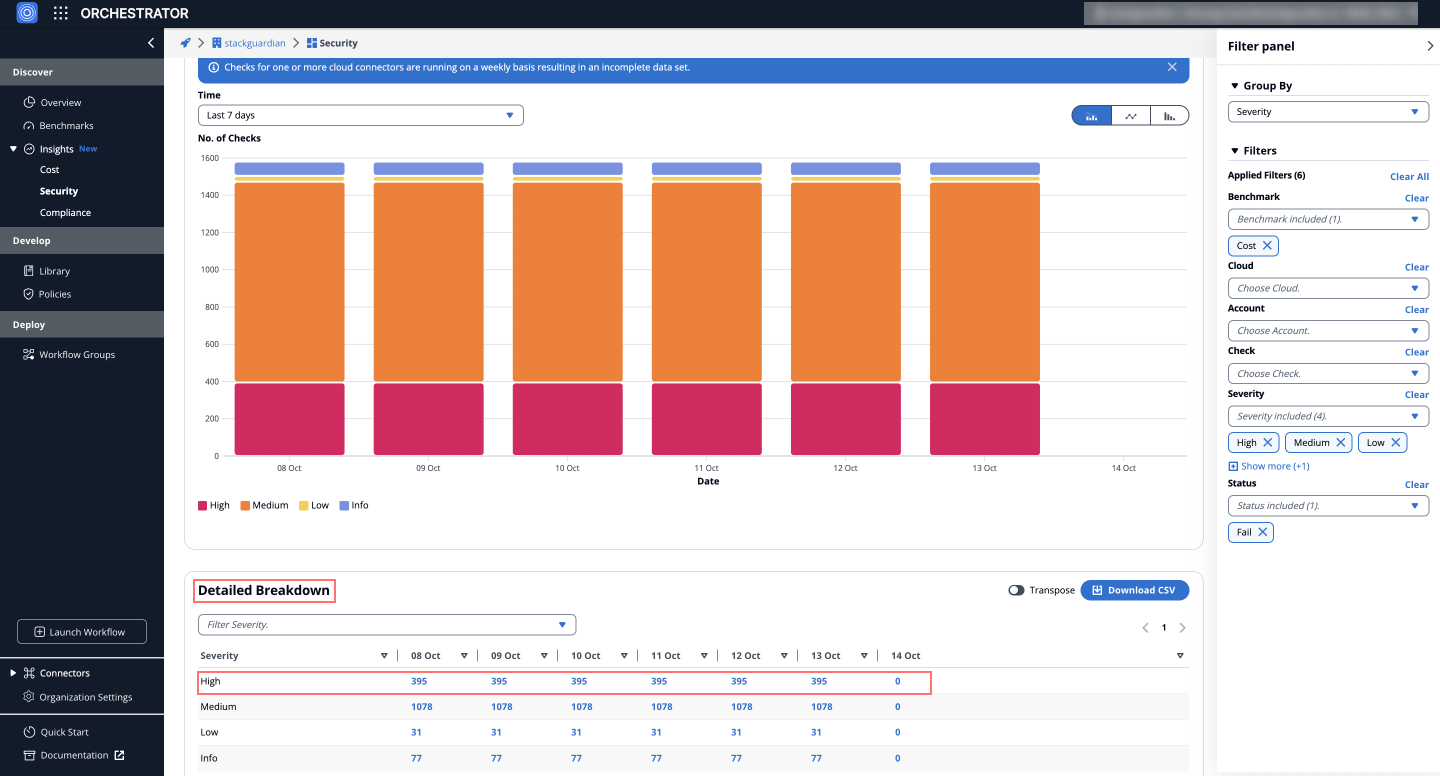
Detail Graphs
Provides an in-depth analysis of security checks over time, utilizing the filter panel to customize views by severity (Critical, High, Medium, Low), cloud provider (AWS, Azure, GCP), account, benchmarks and check status. It includes distribution analysis and a detailed breakdown of failed security checks, helping users identify trends and prioritize efforts.
Distribution of Failed Security Checks Over Time
Visually represents the distribution of failed security checks over time, grouped by severity (Critical, High, Medium, Low). Users can analyze trends and identify periods with higher failure rates for timely interventions and optimizations.
Detailed Breakdown
The detailed breakdown section displays failed security checks by severity (Critical, High, Medium, Low) for each day within the selected time frame, based on the applied filters, allowing users to pinpoint specific issues and prioritize efforts.
Insights: Detailed Breakdown of Failed Security Checks
Detail Checks
To explore a specific day's failed checks:
- Navigate to the Security Dashboard > Detail Graphs > Detailed Breakdown table.
- Click on the counts under the date column for one of the severities (e.g., High, Medium).
This will redirect you to the Detail Checks tab, which lists the failed checks with severities for that date, providing detailed insights into the issues.
Failed Check Details
On the Detail Checks tab, clicking on a specific failed check provides a detailed tabular view that lists the reasons, resource, status and more for the corresponding cloud account.
This view allows users to pinpoint the affected resources and understand exactly what needs to be done to bring them back into compliance.