Cost Dashboard
The Insights Module serves as a simplified yet powerful analytics dashboard, offering a clear view into your cloud infrastructure. It processes complex data to provide straightforward, actionable information, helping teams to enhance their cloud operations and reduce unnecessary costs.
Cost Dashboard
This feature is a component of the Insights module that offers visibility into your cloud spending. It highlights inefficient areas by showcasing failed checks categorized by severity. This allows for an in-depth analysis and optimization of cloud expenditure, ensuring cost-effectiveness across your cloud resources.
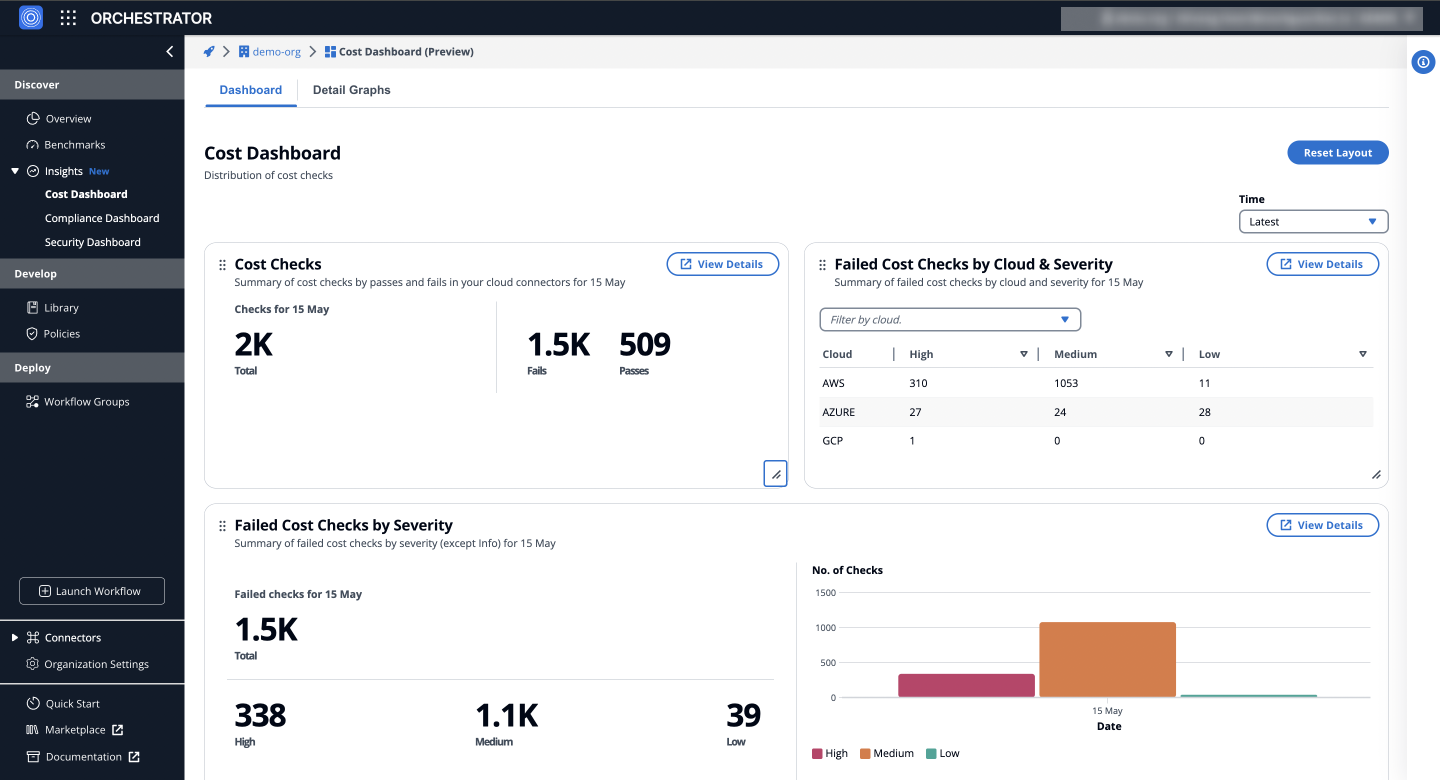
a) Cost Checks
Provides a summary of cost checks by passes and fails in your cloud connectors, offering a total count of checks performed and their outcomes.
b) Failed Cost Checks by Cloud & Severity
Illustrates the distribution of failed cost checks across different clouds (AWS, Azure, etc.) and their severity levels (high, medium, low), facilitating targeted improvements.
c) Failed Cost Checks by Severity
Displays the total number of failed cost checks categorized by their severity, emphasizing areas that require immediate attention.
Insights: Cost dashboard
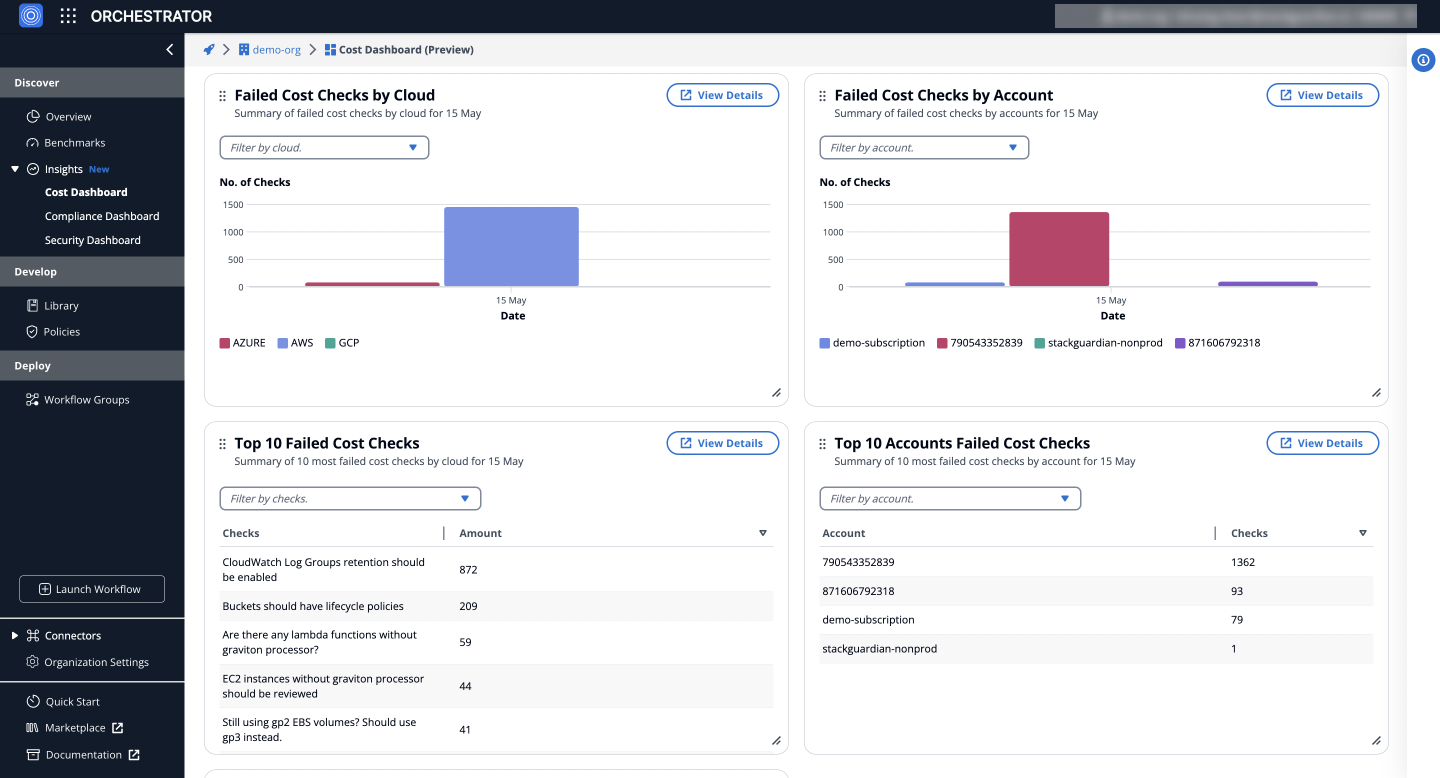
d) Failed Cost Checks by Cloud
Summarizes failed cost checks per cloud provider, enabling insights into which cloud environments might be incurring higher costs due to misconfigurations or inefficiencies.
e) Failed Cost Checks by Account
Details failed cost checks by account, helping identify specific accounts that may be contributing disproportionately to cloud spend inefficiencies.
f) Top 10 Failed Cost Checks
Lists the 10 most failed cost checks, pinpointing the common areas of cost wastage or mismanagement across the cloud infrastructure.
g) Top 10 Accounts Failed Cost Checks
Highlights the top 10 accounts with the most failed cost checks, indicating potential targets for cost optimization and efficiency improvements.
Insights: Cost dashboard
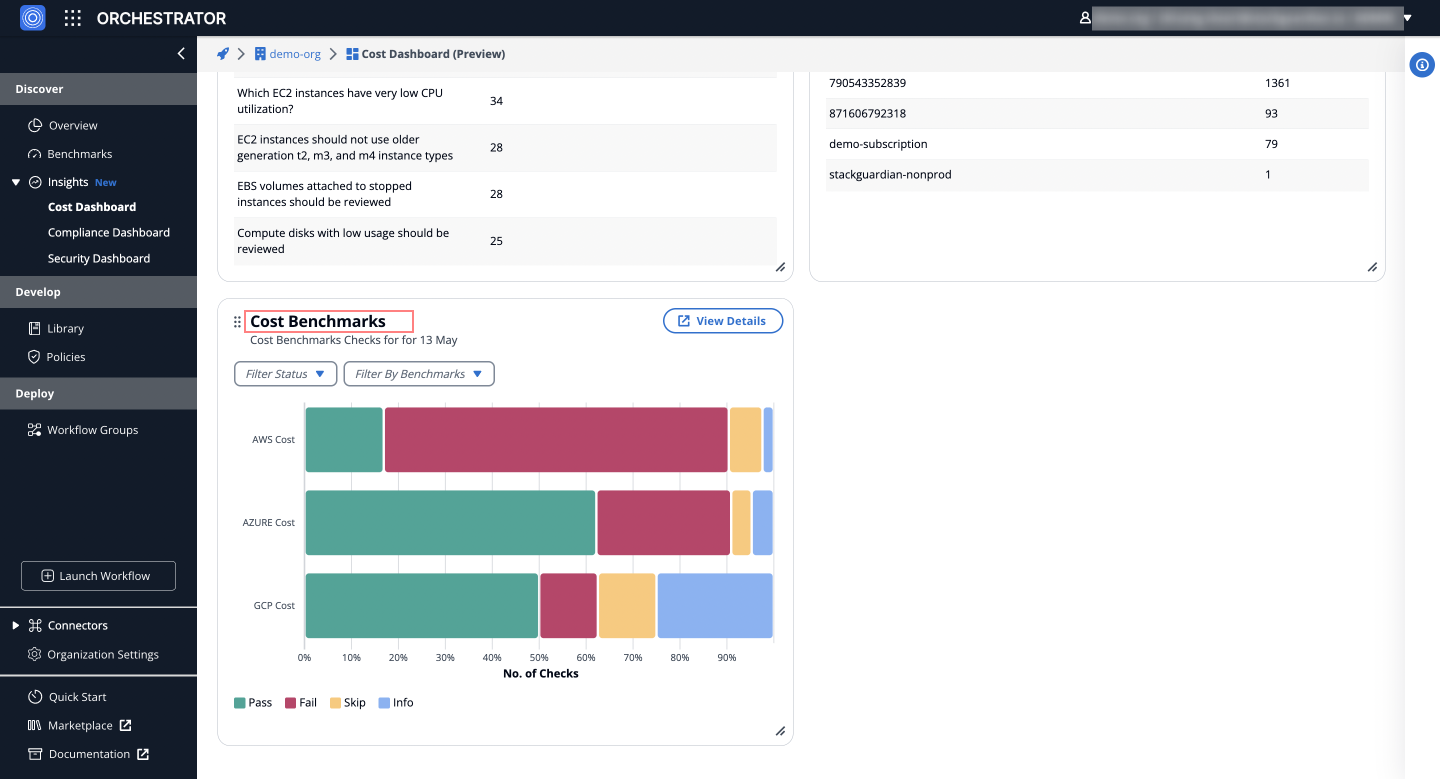
g) Cost benchmark
Visualizes cost check performance across AWS, Azure, and GCP, highlighting areas for potential cost optimization.
Detail Graphs
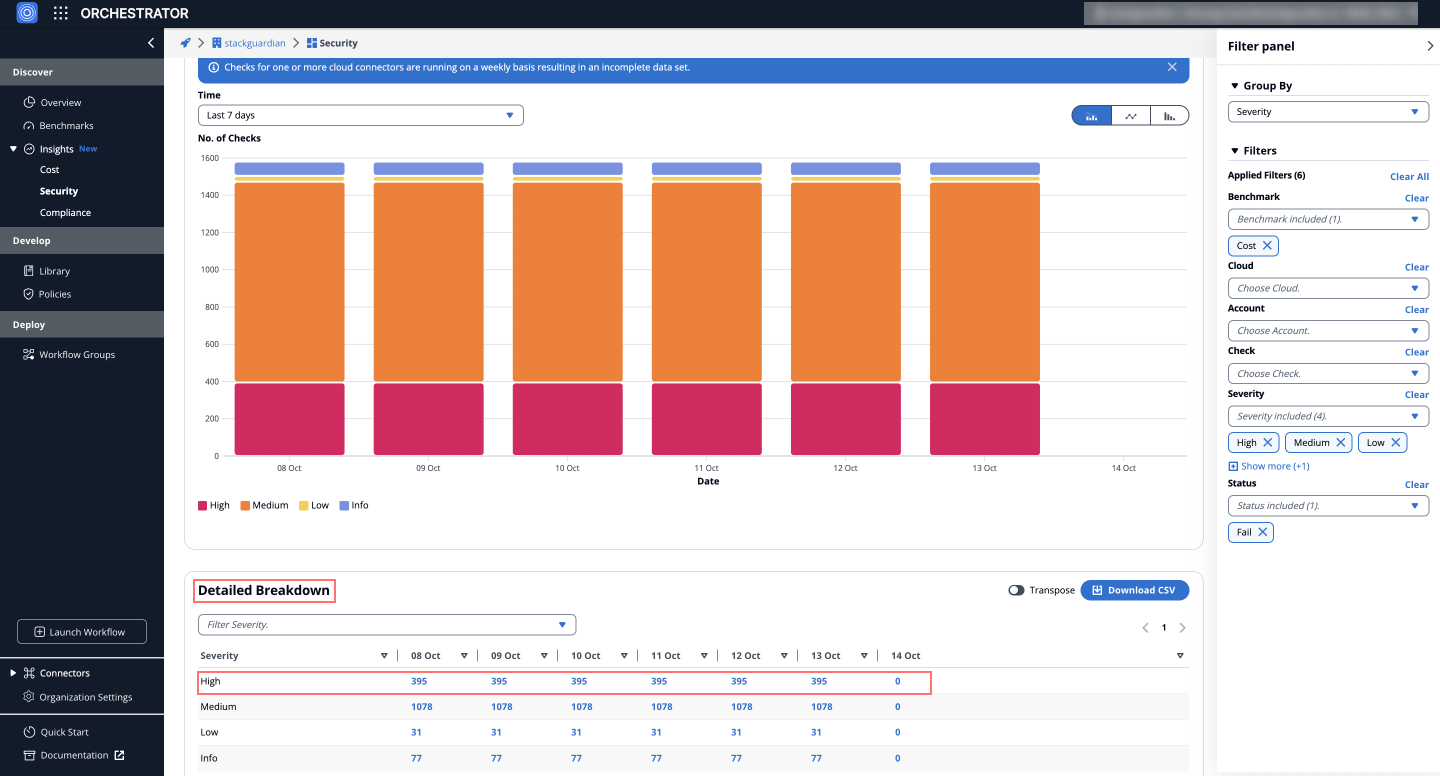
Provides an in-depth analysis of cost checks over time, using the filter panel to customize views by severity, cloud provider, account, benchmarks and check status. It includes distribution analysis and a detailed breakdown of failed cost checks, helping users identify trends and prioritize efforts.
Distribution of Failed Cost Checks Over Time
Visually represents the distribution of failed cost checks over time, allowing users to analyze trends and identify periods with higher failure rates for timely interventions and optimizations.
Detailed Breakdown of Failed Cost Checks
The Detailed Breakdown section, as shown in the screenshot, displays the failed cost checks by severity (High, Medium, Low, Info) for each day within the selected time frame. This breakdown is based on the filters applied, allowing users to identify and prioritize specific issues effectively.
Insights: Detailed Breakdown of Failed Cost Checks
Detail Checks
To explore a specific day's failed checks:
- Navigate to the Cost Dashboard > Detail Graphs > Detailed Breakdown table.
- Click on the counts under the date column for one of the severities (e.g., High, Medium).
This will redirect you to the Detail Checks tab, which lists the failed checks with severities for that date, providing detailed insights into the issues.
Failed Check Details
On the Detail Checks tab, clicking on a specific failed check provides a detailed tabular view that lists the reasons, resource, status and more for the corresponding cloud account.
This view allows users to pinpoint the affected resources and understand exactly what needs to be done to bring them back into compliance.